Methodology: Obtaining and Cleaning Data
 If you are scared with the possibility of AI taking our jobs, be more scared if the data that we feed AI do not undergo any cleaning prior to being fed to our Machine Learning models. This article is a glimpse on how such preprocessing is necessesary to have some meaningful and unbiased information from big data …
PART ONE
Prior to data analysis, acquiring data and preparing them to be analyzed requires the following procedures:
Raw Data -> Processing Script -> Tidy Data -> Data Analysis -> Data Communication
The raw data for this project will be exported as Comma Separated Values or CSV files from exports of a computer firewall and a packet capture tool, like Wireshark. It is important to make sure that the data is ideal to be imported to data analysis tools. Ideal data to be used for analysis has the following requirements:
- Every single row has an observation
- Every single column has one variable
Definition of Data: “Data are values of qualitative or quantitative variables, belonging to a set of items.” (wikipedia).
set of items = population or set of objects of interest values = variables that we want to measure qualitative: what types of protocol: TCP, FIX, or UDP; source IP Address: 192.168.32.0 quantitative: measurable data like time, detla time, number of bytes, etc..
As we can see with the case of IP Addresses, not all numbers are quantitative in nature. Processing data from raw data to tidy data is done using packages in R. All steps in data processing should be recorded and this can be done via Git or Github,
www.howtogeek.com has a page devoted to explaining what Git or Github is: “Git is an open-source version control system that was started by Linus Trovalds – the same person who created Linux. Git is similar to other version control systems – Subversion, CVS, and Mercurial to name a few.”
It is critical to pay attention to what is happening to the data while going through processing is crucial to analysis, so any tools that help preserve the history of the data that is being processed will help in times we need to present that data has not been altered or reconfigured, revert back to an older version, etc…
Changes in data, especially data related to computing, may be hard to monitor by human senses. However, machine learning procedures or data analysis can use the combination of tools to analyze each stages or changing variables that may later form the signature corresponding to a particular exploitation.
PART TWO
For this project, data coming from various sources are added frequently. At minimal, getting enough data to get some meaningful analysis will just be packet capture lasting a few minutes since storing these logs is dependent on how big the storage is. Real-time analysis can be limited to “the past 30 minutes of packet capture” for this project, but ultimately, data should be streaming to R. It still needs to be processed:
The original source data -> few R programs responsible to process data -> from raw data, a small subset will be cleaned to get ready for analysis -> (output) subset data that will be inputted to R programs responsible for explanatory analysis
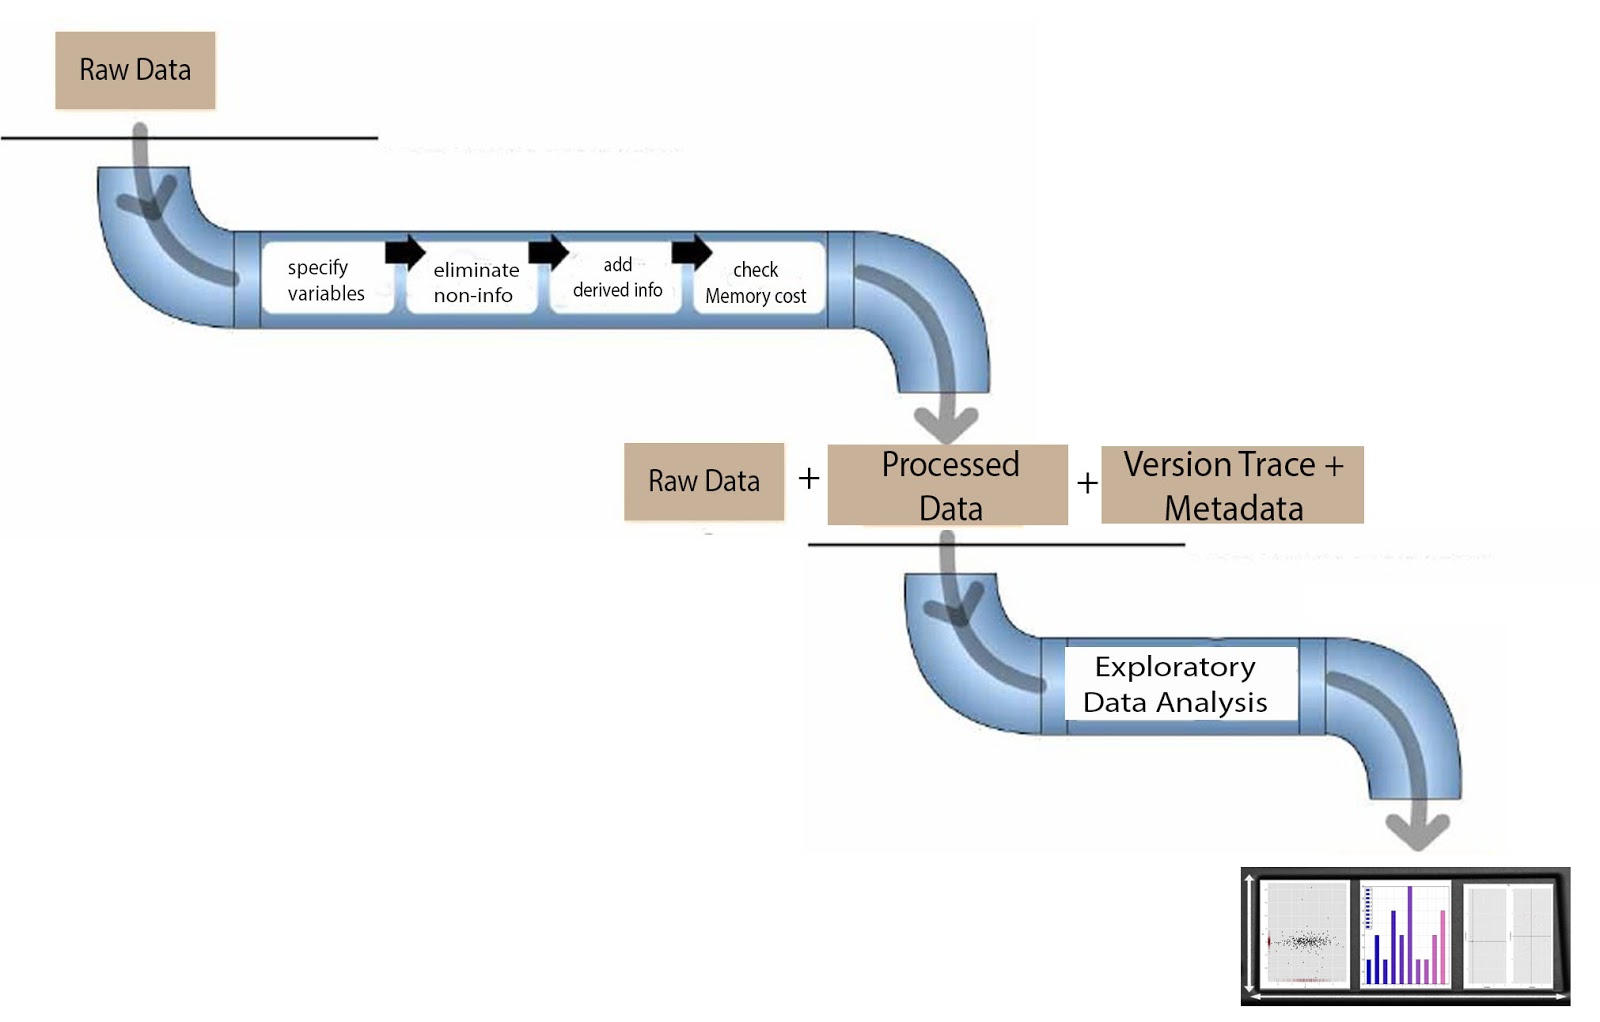
One process for tidying up data may include specification of variables, elimination of information that are not needed, computation of derive information, and checking if data can be managed by the computer’s memory. All these may also involve merging, sub-setting, and transformation of data. It is critical to pay attention and record all the steps done to the data.
In the end of data clean up, Exploratory Data Analysis (EDA) input should have:
- Original Raw Data
- Processed or tidy data
- each variable measured in one column
- each observation of variable in one row
- one table for each “kind” of variable
- multiple tables should be linked by a variable
- metadata = describes the relationship between values and variables
- version/history print = footprints of how data evolved from raw to tidy, algorithm from 1 to next steps.. so forth..
- Save one file per table
PART THREE
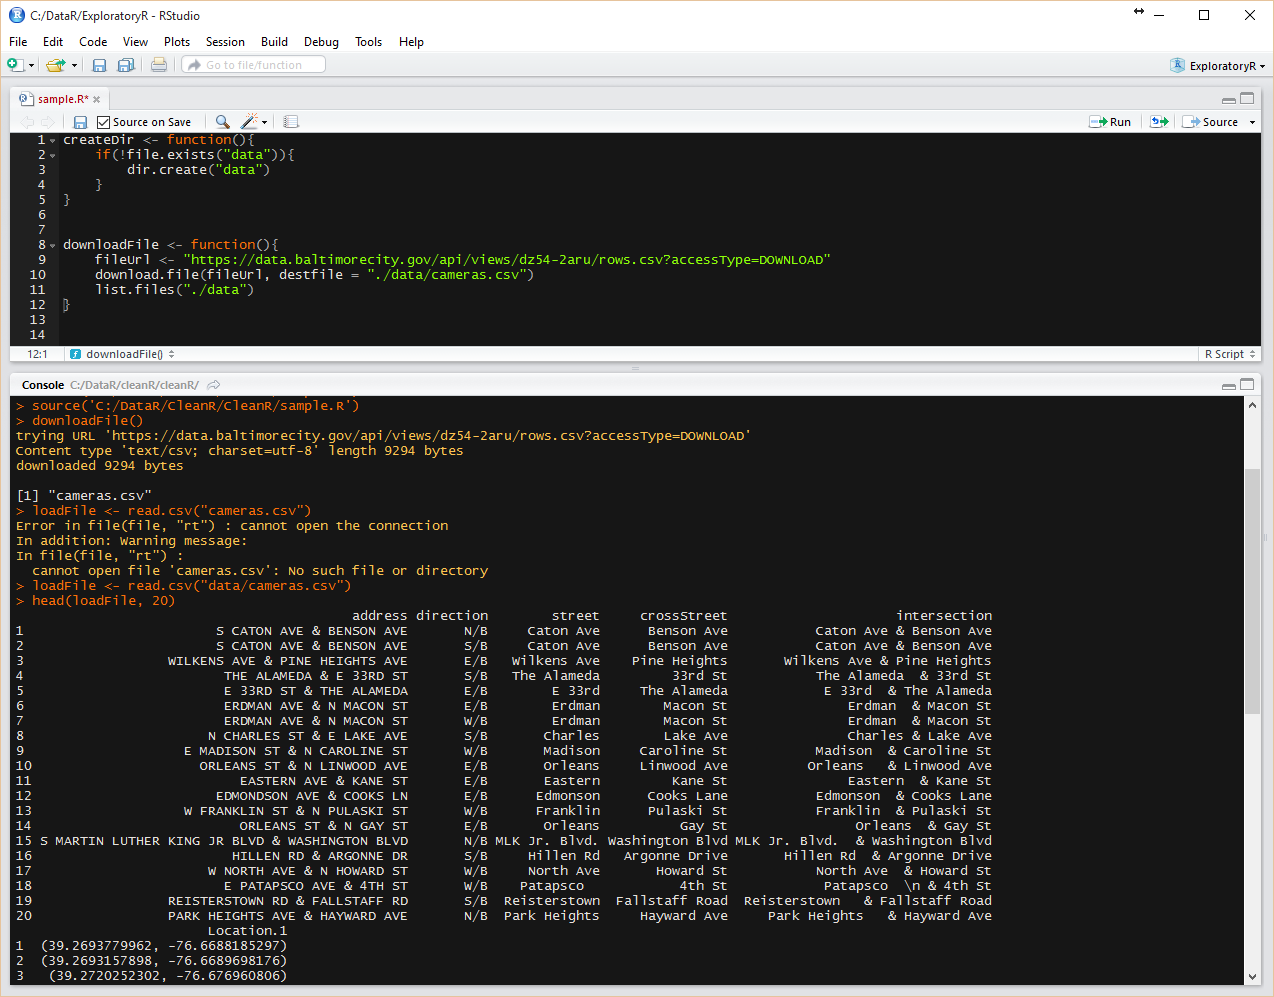
Most raw data come from various sources, including servers located online. Although it is easy to right click and download a file to a local folder and fetch those files from that folder, it is better to actually include the download script within the R script that will be using the data.
A review of R commands that might be helpful in the creation of automated scripts is listed below: