Applying Machine Learning in IT:
 Collecting logs is a standard practice in IT. Normally, giving storage space to newer data is a prirority that is why most systems clean up their logs or historical data for after some time. The decrease in cost of storage devices made possible to keep historical logs longer than usual.
The abundance of log files can be utilized to learn about the baseline behavior of ones system and also learn about anomalies that occur historically and use what is learned to predict or assess system behavior.
In this post, I employ the process of “Anomaly Detection”, which is a kind of unsupervised machine learning approach.
Anomaly Detection Unsupervised Learning Approach:
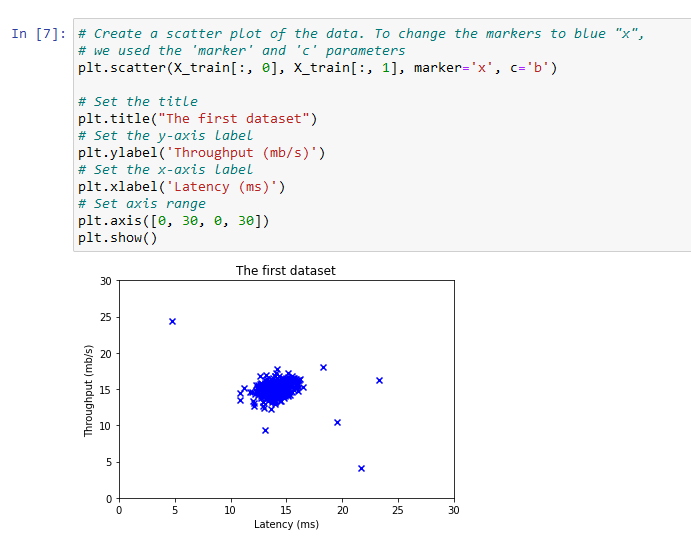
An anomaly detection algorithm to detect anomalous behavior in server computers will be utilized using a dataset that contains two features -
- throughput (mb/s) and
- latency (ms) of response of each server.
As our servers operate, I collected 𝑚=307 examples of how they were behaving, and thus have an unlabeled dataset {𝑥(1),…,𝑥(𝑚)}
.
The vast majority of these examples are “normal” (non-anomalous) examples of the servers operating normally, but there might also be some examples of servers acting anomalously within this dataset.
I will use a Gaussian model to detect anomalous examples in this dataset.
I will first start on a 2D dataset that will allow me to visualize what the algorithm is doing.
On that dataset I will fit a Gaussian distribution and then find values that have very low probability and hence can be considered anomalies.
The Dataset:
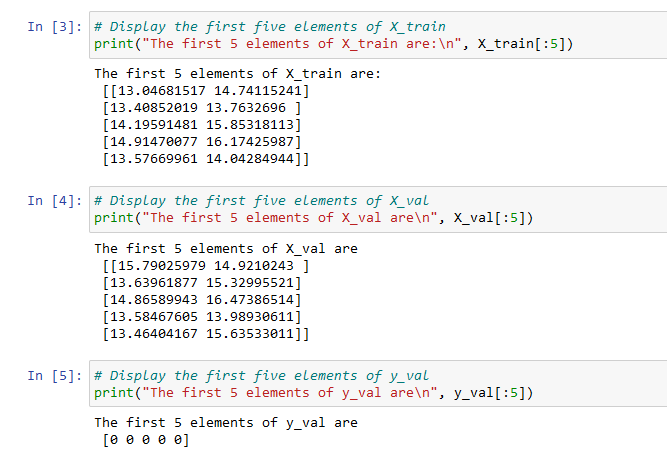
We will load X_train, X_val and y_val from the dataset.
using X_train to fit a Gaussian distribution using X_val and y_val as a cross validation set to select a threshold and determine anomalous vs normal examples
Visualize the Data:
Gaussian Distribution (Normal or Bell Curve):
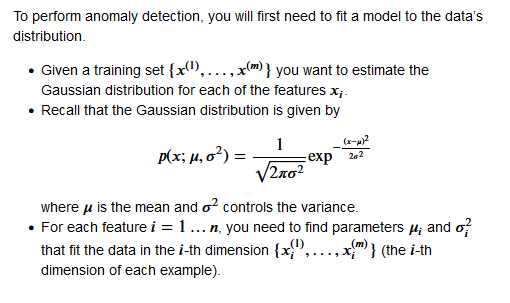
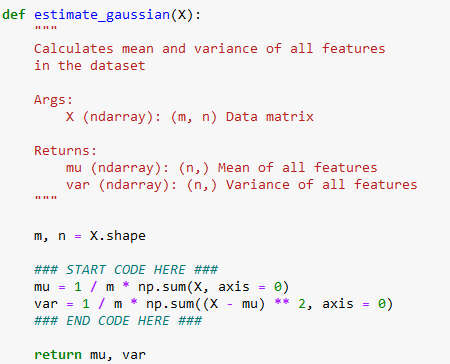
Code to Estimate the Parameters for Gaussian:
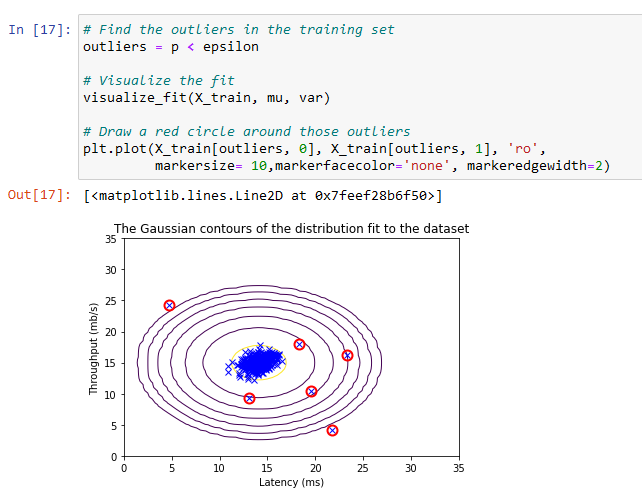
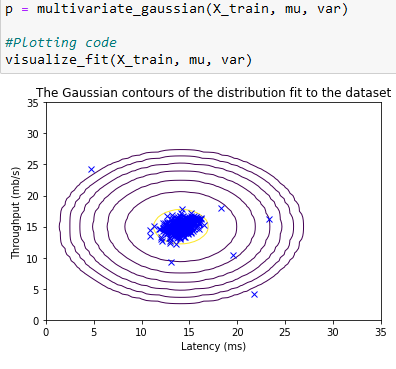
Plotting with Estimate against a Gaussian Contour:
Plotting this estimate shows that most of the examples are in the region with the highest probability, while the anomalous examples are in the regions with lower probabilities.
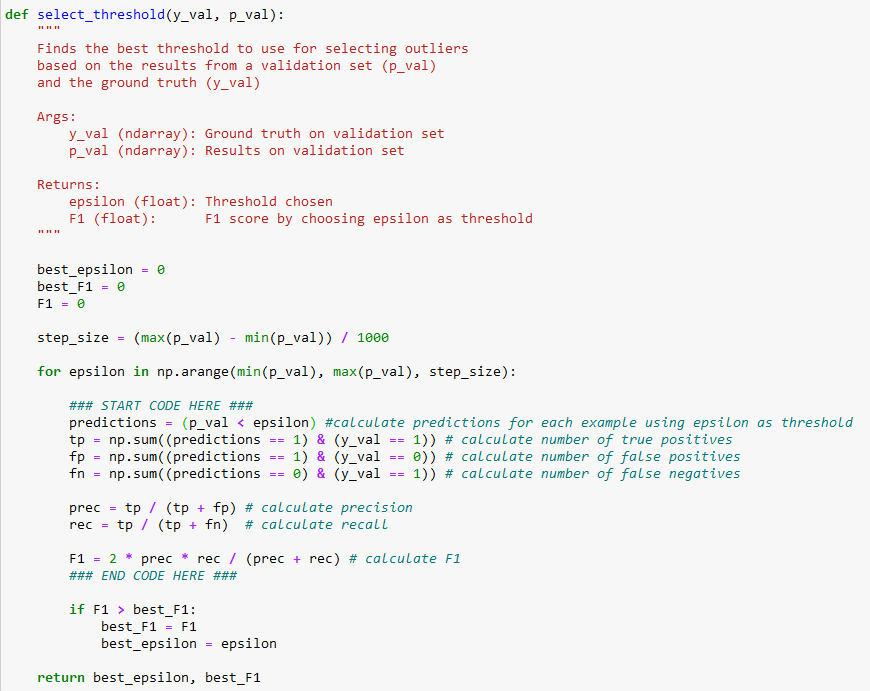
Selecting the Threshold:
The Classified Anomalies
Summary:
Extracting valuable information from historical data that is continuously collected can be valuable to detect problems in any IT system. Even with a real-time dashboard that can be viewed by IT administrators, it would be a challenge to be vigilant in finding anomalies by merely observing certain metrics visually. IT systems produce a stream of events that need to be sorted out prior to effectively find some valuable insights and machine learning can be employed to help.
This post shows an example of when data about the throughput and latency of a system can be analyzed to sort out potential problems. Other metrics can be utilized and analyzed and fed into an unsupervised learning “Anomaly Detection” program such as demonstrated in this post.